Granafa setup
Resiliency Operator offers the option of leveraging an existing Grafana installation to monitor the state of the synchronization and recovery process. Users can incorporate the provided visualizations to their workflows in a transparent manner without affecting their operability.
Prerequisites
Grafana Operator
The operator installation includes the necessary tools to extract the information from it. To view that information with the official dashboard, is required that the management cluster has the Grafana Operator installed.
Process
Create the Dashboard
Create the GrafanaDashboard from the release manifests:
kubectl apply -f https://astronetes.io/deploy/disaster-recovery-operator/v1.2/grafana-v5-dashboard.yaml
Working with the dashboard
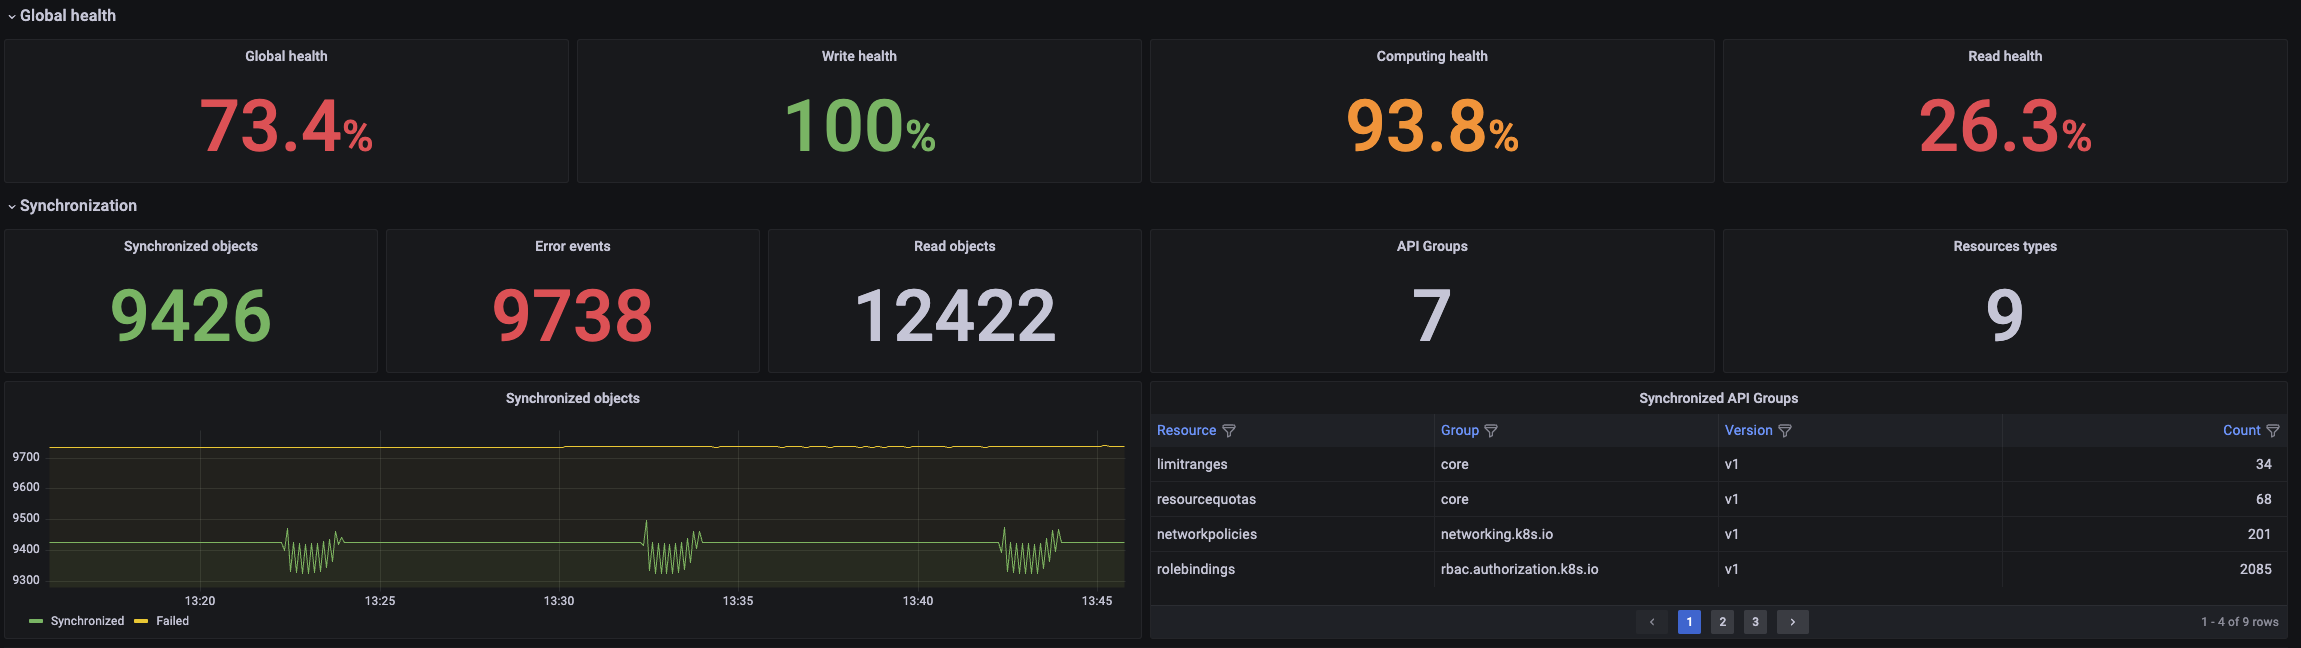
The dashboard shows detailed information about the write, read and computing processes alongside a general overview of the health of the operator.
General view of the status of the operator:
The dashboard can be filtered attending the following characteristics:
- Namespace. Only shows information related to the
LiveSynchronizationsin a specified namespace. - Recovery Plan. Filters by a specific
LiveSynchronizaton. - Object Namespace. Only shows information of the objects located in a given namespace regardless their associated
LiveSynchronization. - Object API Group. Objects are filtered attending to the API Group that they belong to.
Filters can be combined to get more specific results e.g. Getting the networking related objects that belong to a LiveSynchronization that is deployed in a namespace.